Fire Sleuths Can Spark Story Ideas With Wildland Urban Interface Data Maps [1]
 [2] [2] |
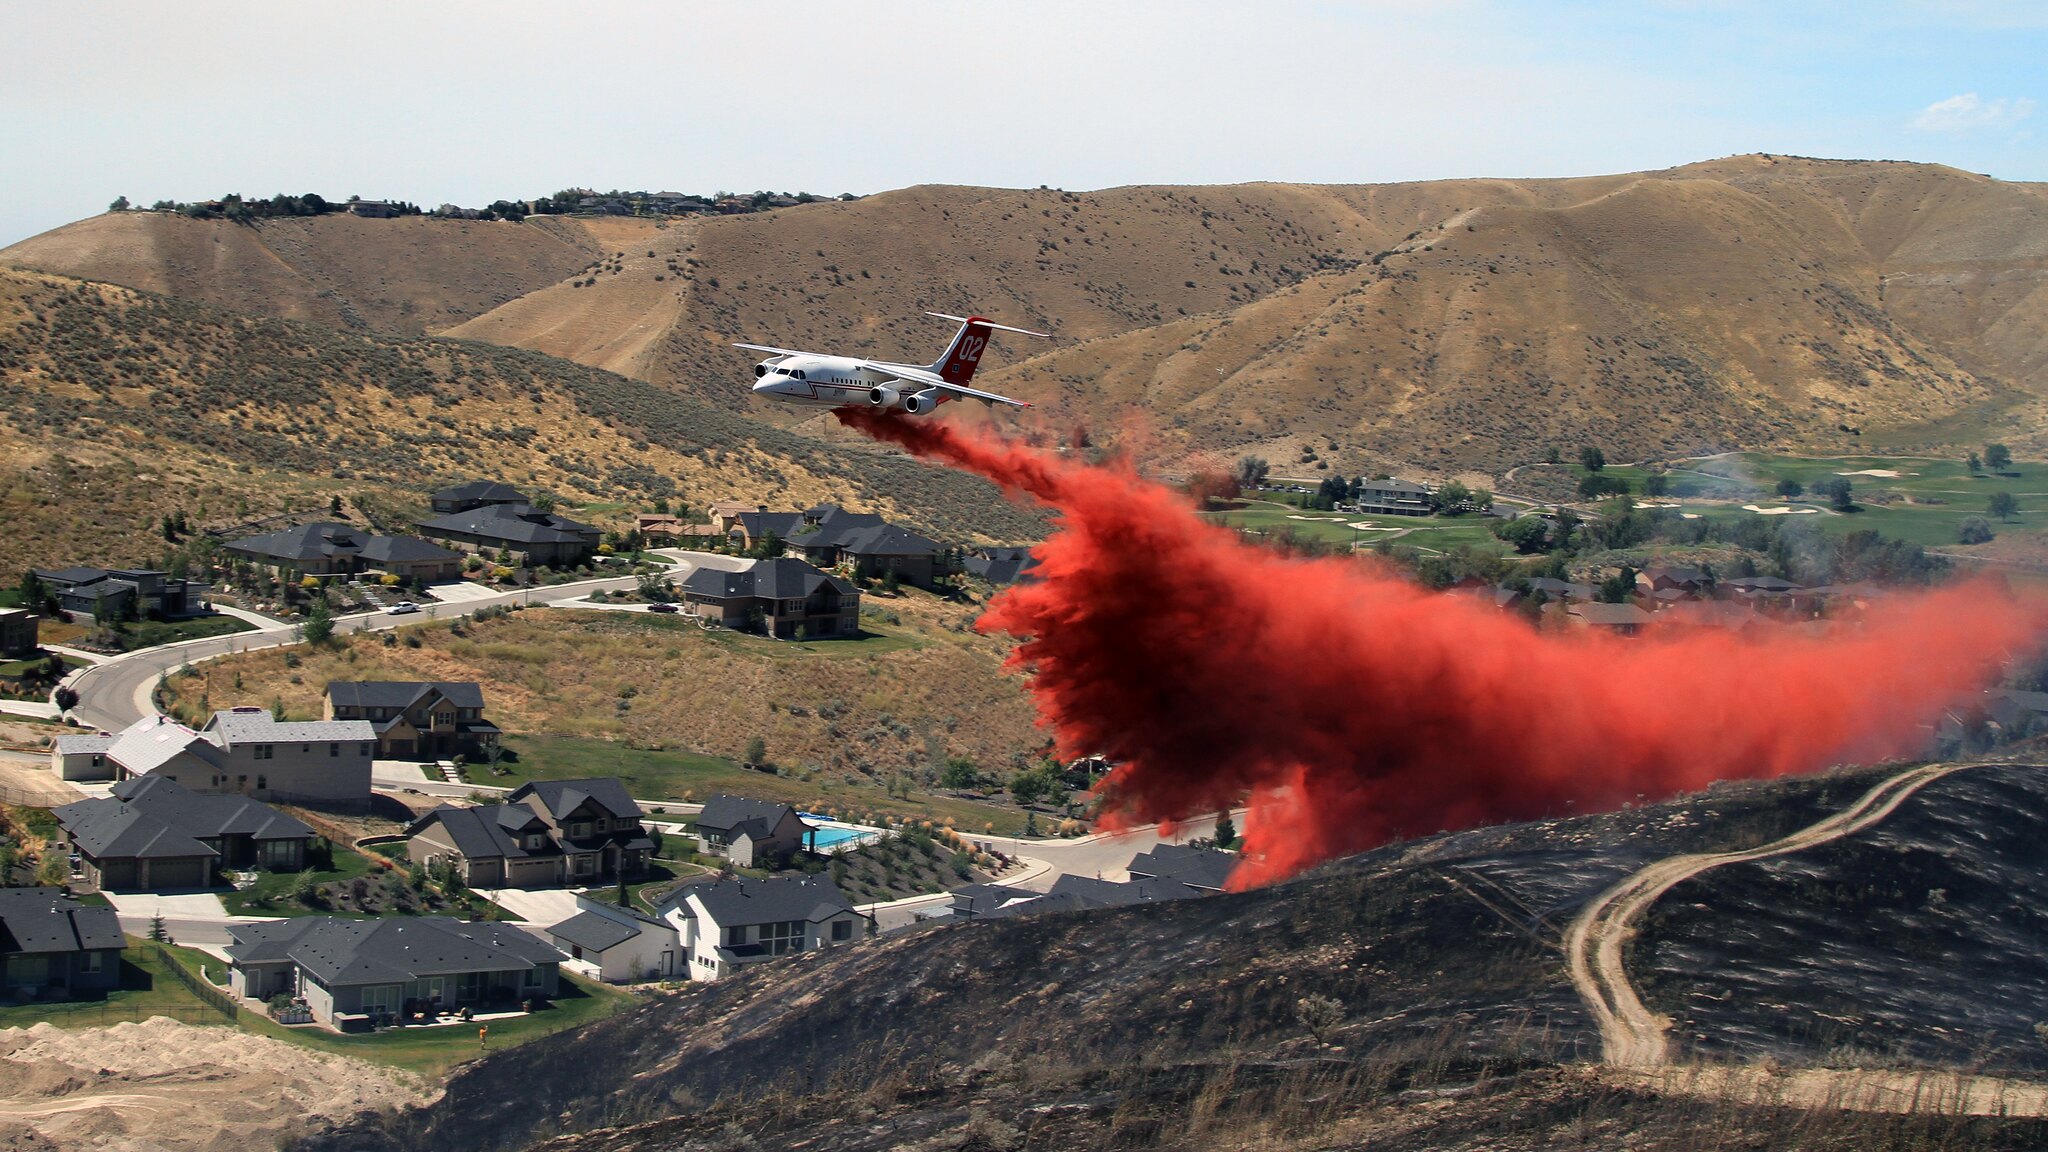 |
| An air tanker drops fire retardant to help stop the spread of the Eyrie Fire in the Boise Foothills in southern Idaho in 2015. Photo [3]: Bureau of Land Management/Austin Catlin, National Interagency Fire Center via Flickr Creative Commons (United States government work [4]). |
Reporter’s Toolbox: Fire Sleuths Can Spark Story Ideas With Wildland Urban Interface Data Maps
By Joseph A. Davis
In 2018, the Camp Fire [5] in Northern California raced through the town of Paradise, killing 85 and destroying 18,000 structures.
It wasn’t as if the community hadn’t been warned. The area had seen 13 large wildfires since 1999. The town was in the middle of a forest.
Fire scientists (yes, there are wildfire scientists) call such places the “wildland urban interface.”
But perhaps few environmental journalists know that the U.S. Forest Service offers a data map of the wildland urban interface for the entire United States.
The map is free and openly available online. You can download the raw data. Start exploring it here [6] (you’ll need to zoom in).
Where the data comes from and how to use it smartly
The foundational raw data comes from two places: the U.S. Census [7] and the U.S. Geological Survey’s National Land Cover Database [8].
Both of these data sources are quite accurate and reliable.
The Land Cover Database is ultimately satellite-based and put together by a consortium of federal agencies, including the U.S. Forest Service and the USGS.
The simplest and most important question this database helps answer is “Is someone in my community going to see their house destroyed by wildfire?”
Of course, it won’t tell precisely whether and when. But it will help you gauge the odds. (If someone in your audience thinks buying a beach house is the answer, maybe remind them of the Lahaina fire [9] of 2023.)
You must understand that wildfire danger is compounded by a number of factors. They include dryness (drought), heat, wind speed, water supply, topography and other factors.
They also include the availability of evacuation routes. A neighborhood with only one single-lane road out is not a good place to be in a fire.
The resolution of this
wildland urban interface
data is very fine — it actually
maps individual buildings.
The resolution of this wildland urban interface data is very fine — it actually maps individual buildings. Documentation and metadata [10] (data about the data) are thorough and complete (although the data only covers the lower 48 states).
The data has been accumulated over decades, so you can look for historical trends. That history goes back to 1990, and there are historical snapshots every several years. Yes, development can put more people at risk.
Also, the data is in several map formats. The main one is ESRI’s ArcGIS Pro [11], which is best looked at through ESRI’s Map Viewer. The full version of that viewer costs money (although they often give it away at journalism meetings as a promotion).
The online version of the wildland urban interface data is viewed for free through an instance of ESRI Map Viewer.
Ultimately, you can do a lot more with this data if you layer other geodata on top of it. The ESRI Map Viewer is especially adept at custom layering.
And the custom layering is what will make any journalism project unique and meaningful. So you might use map overlay data to ask where the kindergartens and nursing homes are, for example. Or what areas are affected by drought, or covered with snow or hit by tree disease. Or housing prices, or zoning rules or municipal boundaries.
As ever, we encourage users to groundtruth whatever they can, get out there, talk to people and look for yourself.
[Editor’s Note: For more from SEJournal on wildfires, check out our Topics on the Beat page [12], which includes more than two dozen articles from recent issues, plus wildfire headlines [13] from EJToday.]
Joseph A. Davis [14] is a freelance writer/editor in Washington, D.C. who has been writing about the environment since 1976. He writes SEJournal Online's TipSheet [15], Reporter's Toolbox [2] and Issue Backgrounder [16], and curates SEJ's weekday news headlines service EJToday [17] and @EJTodayNews [18]. Davis also directs SEJ's Freedom of Information Project and writes the WatchDog [19] opinion column.
* From the weekly news magazine SEJournal Online, Vol. 11, No. 10. Content from each new issue of SEJournal Online is available to the public via the SEJournal Online main page [20]. Subscribe to the e-newsletter here [21]. And see past issues of the SEJournal archived here [20].