


SEJournal Online is the digital news magazine of the Society of Environmental Journalists. Learn more about SEJournal Online, including submission, subscription and advertising information.
July 15, 2014
Reporter's Toolbox
By ROBERT McCLURE
 |
|
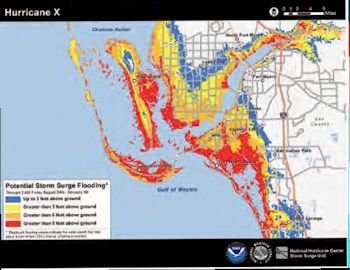
This year NOAA will issue a potential storm surge flooding map for areas along the Gulf and Atlantic coasts at risk of storm surge from a tropical cyclone. |
With Hurricane Georges bearing down on the Florida Keys and cops blocking access to where our editors told us we must go – U.S. 1, the main route into the Keys – photographer Sean Dougherty and I were perplexed. We spent a day piloting our rented SUV through back roads I thought I knew better – ones I’d used going fishing with my dad when I was a kid.
We were bound for Key West to record what happened when Georges stormed ashore that night. About dusk we finally slipped onto the highway just barely out of sight of the blockade to the north. An hour or so later, halfway to Key West, I realized our folly. Crossing the Seven Mile Bridge with the high winds of Georges buffeting our SUV, I seriously wondered if we’d go in the drink. We skated through. But I’d never want to relive that night.
Those memories from 1998 came flooding back as I learned from Amy Wold, who authored our Special Report on Risk and Resilience in this edition of SEJournal, that the National Weather Service this year is making available tools that will help us and our readers/viewers/listeners better anticipate the intensity of storms. If Sean and I’d had those tools we might have made different, smarter decisions.
Here’s what’s new, along with changes to some traditional hurricane-forecast products of the National Hurricane Center aimed to inform reporters and the larger public:
-
New potential storm surge flooding map: This is an experimental product, but it sure does sound promising. Storm surge is, of course, one of the most important factors determining how much damage a given storm does in coastal areas. In fact, the weather service calls it “often the greatest threat to life and property from a hurricane.” And you can’t assume that just because you’re only getting a category 1 or 2 hurricane that storm surge won’t get bad – those Saffir-Simpson hurricane numbers are based only on wind speeds.
This new forecast, to be updated every six hours, will show areas thought to have at least a 10 percent chance of seeing storm surge – pretty much a worst-case scenario. It also projects how deep the surge will be.
That can help news reporters anticipate where to deploy in anticipation of the storm. On the night of Hurricane Georges, Sean and I made it to Key West, but other than a power outage, life continued more or less as normal. The next day we cast about for hours and hours trying to find flooded homes. If only we’d had this new tool, we’d have known where to go a lot sooner. Hint: It wasn’t Key West.
Note that if you’re deciding where to deploy for the duration, keep in mind that just two feet of storm surge can carry away vehicles. More on the dangers of storm surge here.
More on the new flooding maps here.
-
New five-day Graphical Tropical Weather Outlook: Now, the National Hurricane Center issues outlooks covering potential tropical storm development for the next 48 hours. That will continue to be produced (with small changes). But in addition the forecasters will be issuing a five-day Graphic Tropical Weather Outlook, or TWO, that plots tropical disturbances and displays a usually ovalish blob depicting the likely path of the disturbance.
Unlike the 48-hour TWO, this new five-day product will not display the disturbance after it grows to the intensity of tropical storm or hurricane (because the graphic would be too busy to be useful). Both of these products will be produced every six hours when a tropical storm or hurricane is active.
Tool removed to better relate real risks
The National Hurricane Center is eliminating what the agency calls an unfortunately misleading estimate of storms’ intensity at landfall. It’s because people have misused it, as the Hurricane Center explained:
“Unfortunately, the current methodology provides a highly misleading estimate of landfall intensity. Because of the likelihood of misuse for land-threatening storms,(National Hurricane Center) is discontinuing this table until a better procedure to estimate intensity risk can be developed.”
The weather service’s full description is here.
Smaller projected hurricane path
Nowadays the Hurricane Center issues forecasts of a hurricane’s path that are more accurate than ever. For several years running now the Hurricane Center has been narrowing the projected path of a hurricane, the so-called “tropical cyclone forecast cone.” This cone-shaped projected path is derived by looking at forecast errors over the last five years.
It’s a complicated process, but suffice it to say that as improvements are made, the Hurricane Center is able to reduce the size of the area where the hurricane is expected to pass. That might have helped Sean and me that night in the Keys.
And for 2015, expect more changes. Here’s what the Hurricane Center has to say about products the agency is experimenting with this year, noting that the accuracy and timeliness are not guaranteed:
“In 2014, the National Hurricane Center will be working behind the scenes on potential enhancements to products and services. These planned in-house (non-public) experiments include extending tropical cyclone track and intensity forecasts out to seven days from the current five-day period, creation of track and intensity forecasts for disturbances with a high chance of formation, and the issuances of tropical cyclone watches and warningsprior to the formation of a cyclone.”
Florida native Robert McClure is pioneering the concept of a journalism studio for the Pacific Northwest at InvestigateWest, where he serves as executive director. He is a longtime member of the SEJ board of directors and chairman of the SEJournal editorial advisory board, and editor of Reporter’s Toolbox.
* From the quarterly newsletter SEJournal, Summer 2014. Each new issue of SEJournal is available to members and subscribers only; find subscription information here or learn how to join SEJ. Past issues are archived for the public here.
SEJ Publication Types:
Topics on the Beat:
Visibility:

