


SEJournal Online is the digital news magazine of the Society of Environmental Journalists. Learn more about SEJournal Online, including submission, subscription and advertising information.
November 1, 2023
 |
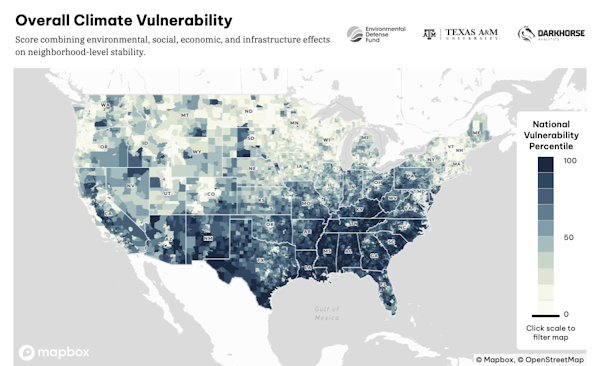 |
| Maps from the new dataset visualize climate impacts at the census-tract level. Image: Climate Vulnerability Index. |
Reporter’s Toolbox: New Climate Vulnerability Index Made for Local, Regional Stories
By Joseph A. Davis
A cool new “data” construction offers environmental journalists a vulnerability index for a wide range of climate risks in U.S. communities.
The U.S. Climate Vulnerability Index is a project of the Environmental Defense Fund (a green advocacy group), Texas A&M University (an academic research institution) and Darkhorse Analytics (a dataviz consultancy).
There are other, similar indexes — but this one only covers the United States and is very high-resolution, taking its data down to the census-tract level (70,000 of them).
Where the data come from
The index integrates some 184 component datasets. They are quite varied so it is hard to generalize as to their quality. And the individual datasets are not easy to find on the site (you ultimately have to download a spreadsheet).
But they appear well-chosen and reliable. For example, some come from the data people at the Centers for Disease Control, which Toolbox has discussed previously.
The index partners have done a lot of quality work on the data themselves, such as scraping and cleaning it. They have also declined to use datasets they consider sketchy and have dropped out pandemic years because of their unique effect on health variables.
Using the data smartly
The index is online and searchable. It is reasonably well documented (methodology here) and includes a brief how-to slideshow for quick orientation.
You can also drill down to select component indicators. And because it uses so many component datasets, the index groups them into subject-based categories: for example, health, socioeconomic impact, environment and infrastructure. Each of these has finer subcategories.
The index will certainly help with
environmental justice stories,
in part because it is designed for
fine-grained geographical searchability.
The index can help with many kinds of stories. But it will certainly help with environmental justice stories, in part because it is designed for fine-grained geographical searchability. Census tracts are very fine-resolution units (each with around 4,000 people) and very easy to cross-index with demographic data.
The data are presented in map form at several levels — federal, state and local. The maps themselves are shaded according to percentile on various categories.
When using the index, journalists should remember that while climate impacts may be very local (and local action may be quite important), most greenhouse gases are quickly mixed into the atmosphere globally. Local emissions may have little relation to local climate impacts.
As always, it is good to put data in context, and advisable to groundtruth any data you can. Do the shoe-leather reporting to give it meaning, humanity and depth.
Joseph A. Davis is a freelance writer/editor in Washington, D.C. who has been writing about the environment since 1976. He writes SEJournal Online's TipSheet, Reporter's Toolbox and Issue Backgrounder, and curates SEJ's weekday news headlines service EJToday and @EJTodayNews. Davis also directs SEJ's Freedom of Information Project and writes the WatchDog opinion column.
* From the weekly news magazine SEJournal Online, Vol. 8, No. 39. Content from each new issue of SEJournal Online is available to the public via the SEJournal Online main page. Subscribe to the e-newsletter here. And see past issues of the SEJournal archived here.
SEJ Publication Types:
Topics on the Beat:
Region:
Visibility:

