SEJournal Online is the digital news magazine of the Society of Environmental Journalists. Learn more about SEJournal Online, including submission, subscription and advertising information.
 |
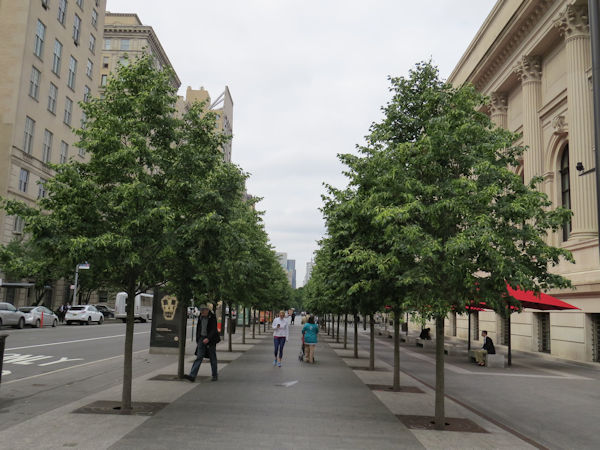
| Above, new trees after planting in 2015 along New York's Fifth Avenue. Photo: DeepRoot, Flickr Creative Commons. Click to enlarge. |
Reporter’s Toolbox: Tree Equity Score Offers Aid in Covering Urban Tree Issues
By Joseph A. Davis
Trees give a huge boost to the quality of life — and the environment — in urban neighborhoods. Sadly, they are scarcer in socioeconomically disadvantaged neighborhoods and more abundant in richer, whiter ones. It’s the result of years of policy choices.
Redlining alone accounts for a good deal of the difference. That was the decades-long federally supported racist policy, now illegal, of denying loans for housing in Black neighborhoods.
But there is really a lot more to the story. Harsh urban growing conditions, stretched municipal budgets, highway development, the pressure of building development and disparagement of environmental values are among the other factors in the equation.
And trees absorb carbon — which helps slow climate change. Moreover they provide respite from the heat in urban heat islands and lower urban pollution levels. Dogs, squirrels and birds like them, too.
One thing that makes the database
different (and relevant) is its focus on
the environmental justice aspects of the data.
Now there is a cool database to help journalists track all this. The “Tree Equity Score,” or TES, has just been released by American Forests, a pro-tree conservation and advocacy organization. One thing that makes it different (and relevant) is its focus on the environmental justice aspects of the data.
According to American Forests, the TES calculates a score for 150,000 neighborhoods and 486 municipalities in urban America — cities and nearby small towns that have at least 50,000 people, which it adds is home to more than 70 percent of the U.S. population.
If you want to start querying the database right now, start here.
Where the data comes from
The data going into the TES database comes from many sources, compiled by an impressive team of forestry and demography experts. In general, tree cover info comes from some national sources like the National Land Cover Database and the U.S. Tree Map. But these are supplemented by a whole bunch of state and local tree-cover databases.
What makes the TES data so relevant is that tree-cover data is overlaid with economic and demographic data that spells out the social equity part of the situation. A lot of this data comes from the U.S. Census, which is very high resolution. Other ingredients come from other expert federal agencies like the Centers for Disease Control and Prevention and the U.S. Geological Survey.
What makes the data so useful for environmental journalists (and actually any local or regional reporters) is its fine resolution — and the close alignment of tree data blocks with demographic data blocks.
You can find a lot more detail on where the data comes from in the TES nerd box (sorry, the TES methodology pages).
Using the data smartly
The TES folks encourage users to put the data in the context of the social equity and environmental issues that it illuminates. They help you to do so by offering plenty of guidance, analysis and data about these dimensions.
For starters, the TES gives more than just tree canopy. It gives corresponding data about population density, income, employment, surface temperature, race, age and health.
But beyond that, it helps you analyze the data in terms of policy choices (with the TES Analyzer, natch). This allows you to examine tree-planting scenarios or to draw custom boundaries for areas you may want to analyze.
If the TES has any drawbacks, it may be that the coverage is skewed a bit toward states like Rhode Island, which was a pilot partner in the project.
If you are the sort of journalist who stresses about “objectivity,” you may notice that the whole TES experience encourages tree-planting. Others may not see that as a bug, but as a feature.
And if you want to go further than the TES for your tree-cover data, you might also check out the U.S. Forest Service’s Tree Canopy Cover Datasets and its National Land Cover Database 2016 percent tree canopy cover, the U.S. Environmental Protection Agency’s EnviroAtlas Percent Tree Canopy Cover map and Global Forest Watch’s U.S. forest maps.
Joseph A. Davis is a freelance writer/editor in Washington, D.C. who has been writing about the environment since 1976. He writes SEJournal Online's TipSheet, Reporter's Toolbox and Issue Backgrounder, as well as compiling SEJ's weekday news headlines service EJToday. Davis also directs SEJ's Freedom of Information Project and writes the WatchDog opinion column and WatchDog Alert.
* From the weekly news magazine SEJournal Online, Vol. 6, No. 27. Content from each new issue of SEJournal Online is available to the public via the SEJournal Online main page. Subscribe to the e-newsletter here. And see past issues of the SEJournal archived here.


 Advertisement


