


SEJournal Online is the digital news magazine of the Society of Environmental Journalists. Learn more about SEJournal Online, including submission, subscription and advertising information.
August 25, 2021

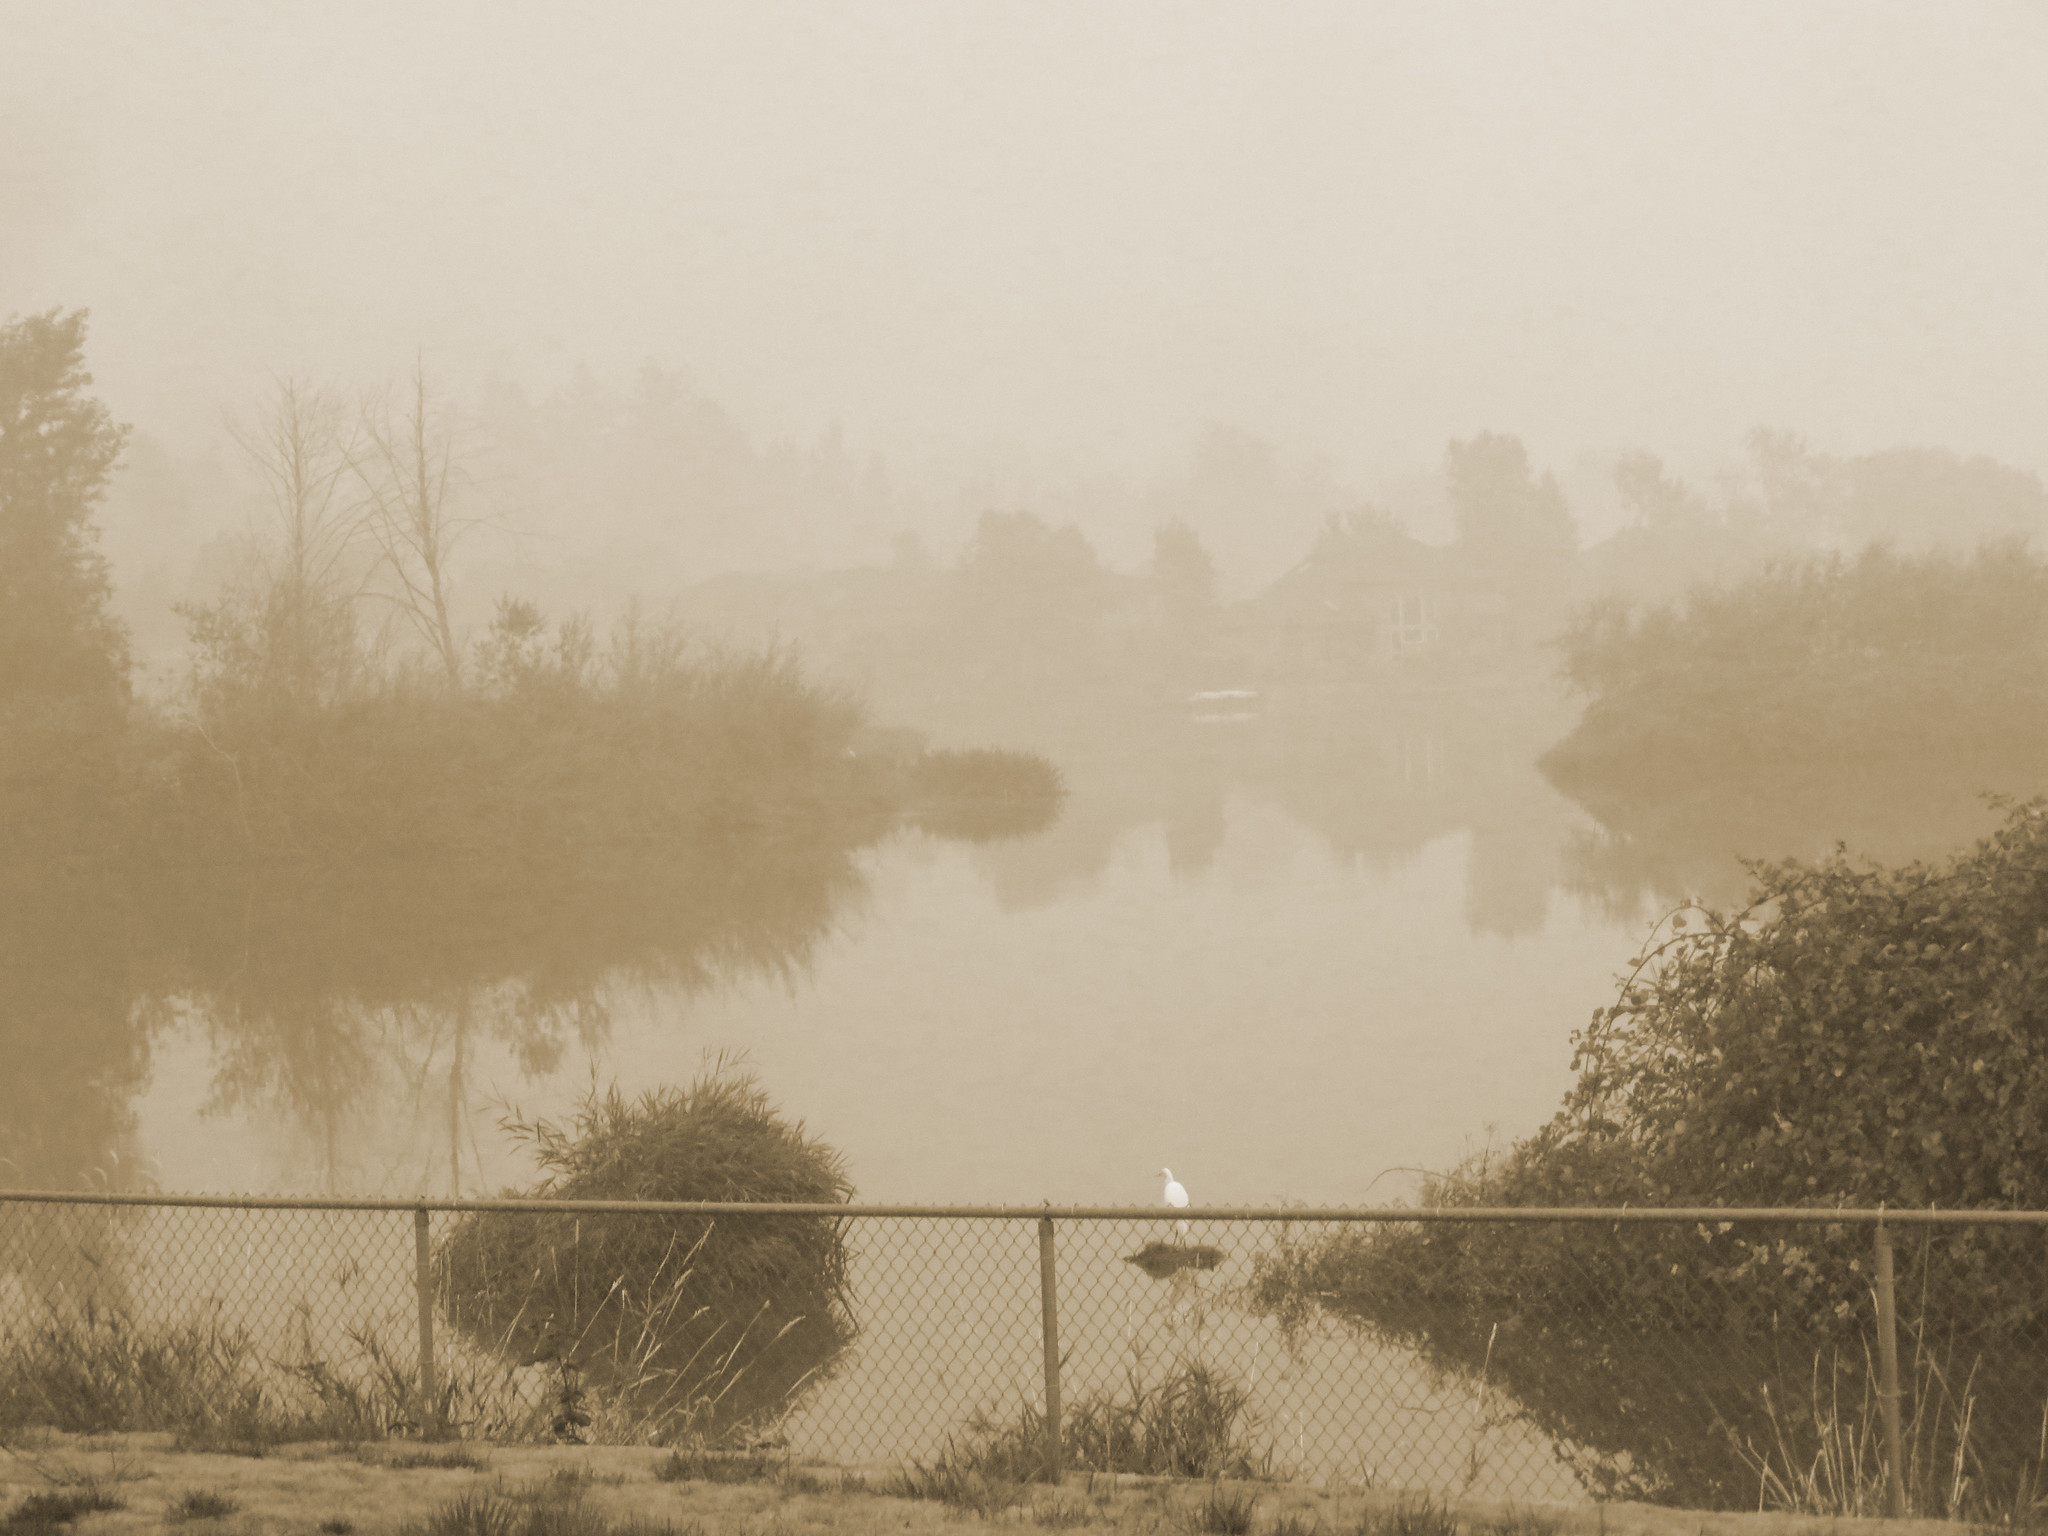 |
| Wildfire smoke obscuring the view from a residential area in Oregon during an April 2019 fire. Photo: Sandra Strait, Flickr Creative Commons. Click to enlarge. |
Reporter’s Toolbox: Air Quality Monitors — and Their Data — Now Easy To Find Via Online Map
By Joseph A. Davis
You may well ask whether you are breathing poisonous air. Who could blame you? Some of the best stories in the history of environmental journalism have started with someone putting an air monitor at the fenceline of a refinery. According to the World Health Organization, air pollution is responsible for one out of eight deaths worldwide.
The good news is that the U.S. Environmental Protection Agency has made finding and accessing air quality monitoring data easier (having got past the Trump years, EPA is once again evolving as a leader among government agencies in the open data realm).
EPA’s interactive map of air quality monitors
is a handy tool — one that environmental
journalists may want to bookmark.
EPA’s interactive map of air quality monitors is a handy tool — one that environmental journalists may want to bookmark.
Where the data comes from
Air quality varies a whole lot from time to time and place to place — and from pollutant to pollutant. There has long been a ragtag network of scientific instrumental measuring stations across the United States, run for various purposes by various agencies. What is new is a web portal for seeing almost all of them in one place online.
Of course, there are many sources of information for air quality stories. One is the Clean Air Act permitting system. Another may be local activist groups, who often do their own monitoring (e.g., the Louisiana Bucket Brigade). State and local agencies may conduct air quality monitoring not included in EPA’s network.
In addition, EPA’s clean air program has other tools, such as the multiagency AirNow mapper, which may better suit your purpose. Or this daily air quality tracker. For transnational stories, there is a United Nations monitoring network. Certainly some journalists have had the resources to do their own air quality monitoring, though good instruments will set you back.
Using the data smartly
Whatever the data source, journalists would do well to first think about the many crucial and cool stories that could come from monitoring-station data. Some suggestions:
Wildfire Smoke: At this time of year, wildfire smoke is an important story, and a transcontinental one. AirNow’s Fire and Smoke Map may be a sharper tool for this purpose. But looking at particulates through the interactive air quality monitor map may be useful.
Summer Smog: In the sunny, hot and humid days of summer, smog spikes because the air cooks its ingredients. The interactive monitor map does show ozone levels at many stations, but AirNow may be more meaningful.
Power Plants: It is worth knowing whether any of the monitors in your area are near a power plant, especially a coal-burning one. Relevant parameters include sulfur dioxide, nitrogen oxides, particulates and heavy metals like lead.
Toxic Chemicals: Petrochemical plants are a major — but not the only — source of toxic air pollutants. There are many of them, and not all may be monitored or even regulated. But the purpose of some air monitors is precisely to catch them. Look particularly for National Air Toxics Trends stations.
Agricultural Operations: Ag operations contribute many different kinds of air pollution — but because of their diffuse locations, few will be caught at monitoring stations. Particulates for sure, since farming gets dusty. Methane from feedlots may be another.
Automobile Pollution: In cities with freeways and congestion, automobile and truck pollution is a major factor in air pollution. Ozone, nitrogen oxides and lead are all relevant parameters. Few monitoring stations are meant to measure vehicle pollution specifically.
Dust and Soot: The scientists call them particulates — whether coarse (PM10) or fine (PM2.5). They are included in the interactive monitor map. But to understand the significance of measurements, you have to know where they come from. Sources include power plants, vehicles, agriculture, wildfires and industrial operations, among others.
Methane Pollution: The interactive monitor map does not include methane — although it is an important pollutant when we consider climate change. Sources include oil and gas operations, solid waste landfills, sewage plants and others. In any case, the best measurements are usually specialized or satellite-borne.
Caveats on air quality data reporting
On a geek level, it takes some work and know-how to extract good information from the interactive map of air quality monitors.
If you don’t know anything about the major air quality parameters, you’d best not play in this sandbox until you do. The prompting and documentation are not always stellar or handy, but taking the time to read available documentation helps.
As wonderful as the network is, you’d do well to remember that it is quite spotty and inconsistent — which means you do trend stories at your peril.
But every environmental reporter worth their salt will want to know where the nearest air quality monitors are. And why.
Editor’s Note: For more on this topic, see our recent Reporter’s Toolbox on tracking respiratory health risks from wildfire smoke, a feature from Beth Gardiner on pursuing the air pollution story and a review of her book on the topic from our BookShelf.
Joseph A. Davis is a freelance writer/editor in Washington, D.C. who has been writing about the environment since 1976. He writes SEJournal Online's TipSheet, Reporter's Toolbox and Issue Backgrounder, as well as compiling SEJ's weekday news headlines service EJToday. Davis also directs SEJ's Freedom of Information Project and writes the WatchDog opinion column.
* From the weekly news magazine SEJournal Online, Vol. 6, No. 30. Content from each new issue of SEJournal Online is available to the public via the SEJournal Online main page. Subscribe to the e-newsletter here. And see past issues of the SEJournal archived here.
SEJ Publication Types:
Topics on the Beat:
Region:
Visibility:

