


SEJournal Online is the digital news magazine of the Society of Environmental Journalists. Learn more about SEJournal Online, including submission, subscription and advertising information.
May 26, 2021

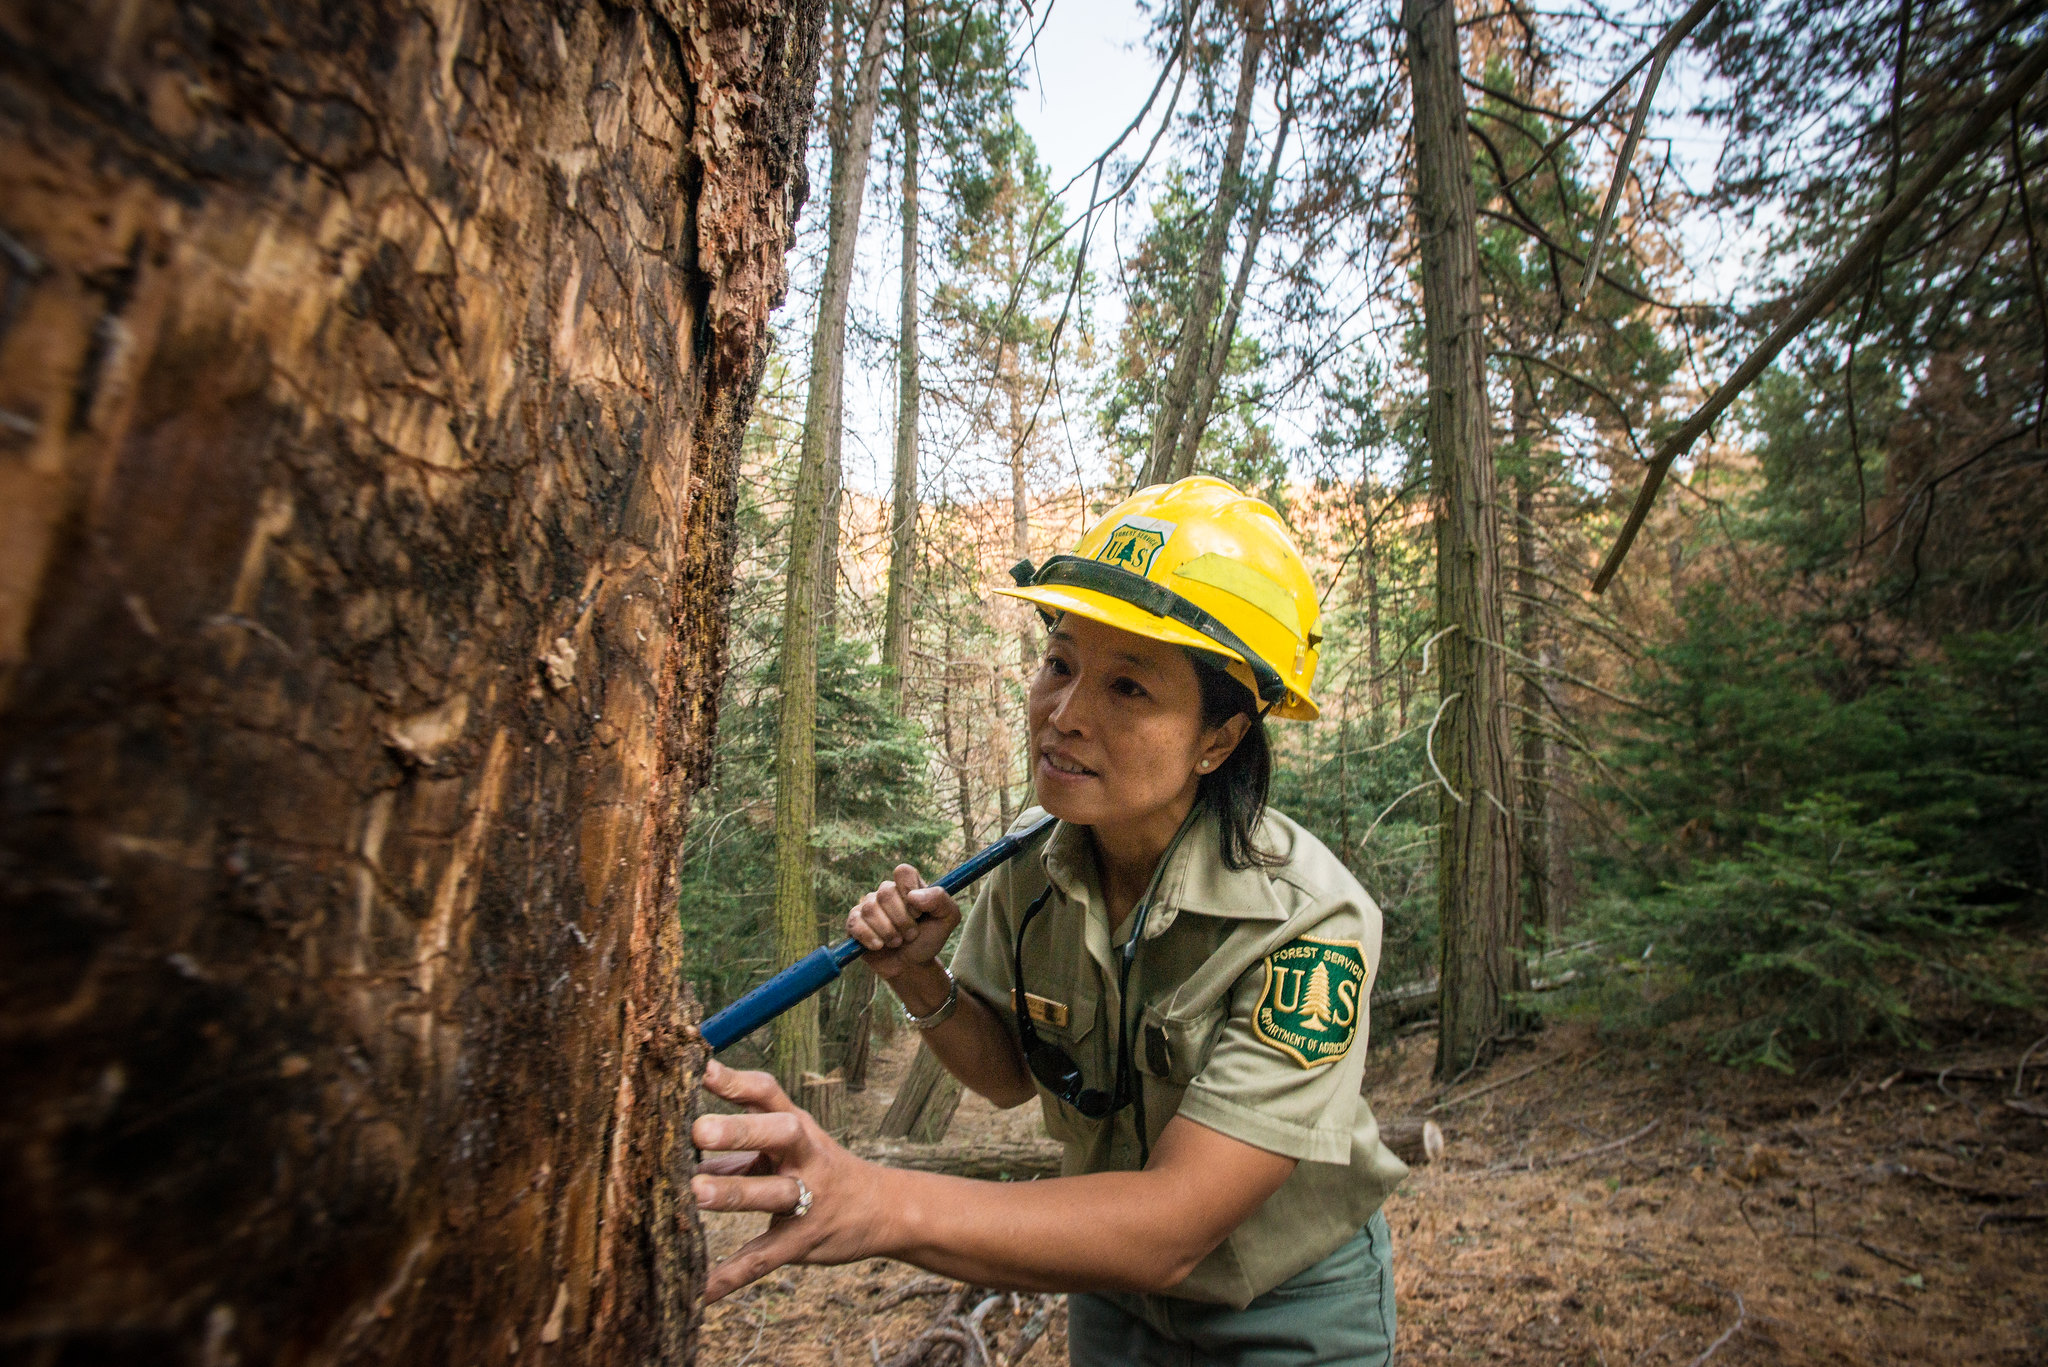 |
| Forest Service databases allow journalists to track the health of U.S. forests. Above, Forest Service entomologist Beverly Bulaon searches for pine bark beetles in dead Ponderosa pine trees in the Sequoia National Forest, near Posey, Calif. Photo: USDA Forest Service/Lance Cheung. Click to enlarge. |
Reporter’s Toolbox: Forest Inventory May Provide Trail Guide to Ongoing Policy Crisis
By Joseph A. Davis
There is a continent-sized world of data about forests in the United States. As climate-related disease, drought and wildfire ravage the forests that sustain us, environmental journalists may want to explore it.
The problem is not getting lost in the woods.
The Forest Inventory and Analysis, or FIA, program is run by the U.S. Forest Service, with a lot of help from other federal and state forest agencies. ln a statistical sense, it tries to account for almost every tree — using aerial surveys, satellite sensing and ground-truth sampling. Check out its portal page.
The FIA databases try to include many parameters important to environmental journalists. One of the most important is who owns the forest land: federal government, state or private owners.
But the data often includes other key variables like carbon content, dead fuel, size of trees, disease status, deforestation, afforestation, cutting, harvesting, thinning, species mix, fragmentation, crown condition, soil type, lichen diversity and even a focus on urban forests. It includes grasslands as well.
How to use the data smartly
Even journalists who are not trained foresters or academic researchers could get pretty excited about this data. The problem is that the data system is far from user-friendly, so it is worth knowing what you want or don’t want, narrowing your focus, lowering your expectations and investing the time to explore and mine the data.
You might even consider finding some trained foresters at a local forest, research center or university to work with you on getting the answers you want.
The quickest and easiest way
in to much of the data may
be the state fact sheets.
The quickest and easiest way in to much of the data may be the state fact sheets. Do not scorn them because they are predigested and graphically accessible. In fact, if you are working in this area at all, you probably know that a big part of forest ownership, problems and policy conflict happens at the state level.
But the fact sheets are not data journalism. So if you are a hardcore bare-metal data geek, you will be happy to know that you can download all the data in flat-file formats like CSV, so you can monkey with it on your own.
Geek or not, you can be grateful for the extensive documentation of what’s in each data set — and copious efforts to explain how to use the data. Some of that documentation can be found in this user guide and in this library, just for starters.
You have to give the agency credit for the training and tutorials it provides. It even has a help desk you can call. The general public can access much of the online data — but you may get more by registering for an account, if only because it allows you to save queries and reports.
The problem is that when you are actually using the search and query tools, you do not get much helpful, intuitive, contextual coaching on what you need to do and how to do it. A main query tool is the “Design and Analysis Toolkit for Inventory and Monitoring (DATIM).” Give it a whirl.
Where the data comes from
It helps if you understand how some of the data going into the FIA is acquired. For example: the National Woodland Owner Survey, a joint project of USFS and other institutions, has its own dashboard for queries. Sometimes this may do the job for you.
But it takes a lot of time and work to gather this data, so some of the datasets are years and years old. The FIA does offer clues about the age of data, so you’ll have to account for that.
Much of this data comes via sampling. If you took college statistics (even if you flunked it), you may know that statistics is a set of math methods for guessing how likely a given sample is to accurately represent a whole population (of trees, in this case).
The FIA offers statistical tools (such as its EVALIDator) for evaluating sampling error. So even though the FIA database doesn’t literally include every U.S. tree, it will try to tell you the likelihood that each of its datasets represents every tree.
There is a lot more to the FIA. Good journalists with good questions learn not to be intimidated. You may work up more courage (and questions!) by strolling through the FIA site’s “Engagement Portfolio,” a gallery of cool and intelligible reports based on the data. Another inspiring overview is the FIA’s series of annual business reports.
Joseph A. Davis is a freelance writer/editor in Washington, D.C. who has been writing about the environment since 1976. He writes SEJournal Online's TipSheet, Reporter's Toolbox and Issue Backgrounder, as well as compiling SEJ's weekday news headlines service EJToday. Davis also directs SEJ's Freedom of Information Project and writes the WatchDog opinion column and WatchDog Alert.
* From the weekly news magazine SEJournal Online, Vol. 6, No. 21. Content from each new issue of SEJournal Online is available to the public via the SEJournal Online main page. Subscribe to the e-newsletter here. And see past issues of the SEJournal archived here.
SEJ Publication Types:
Topics on the Beat:
Region:
Visibility:

