


SEJournal Online is the digital news magazine of the Society of Environmental Journalists. Learn more about SEJournal Online, including submission, subscription and advertising information.
June 7, 2023

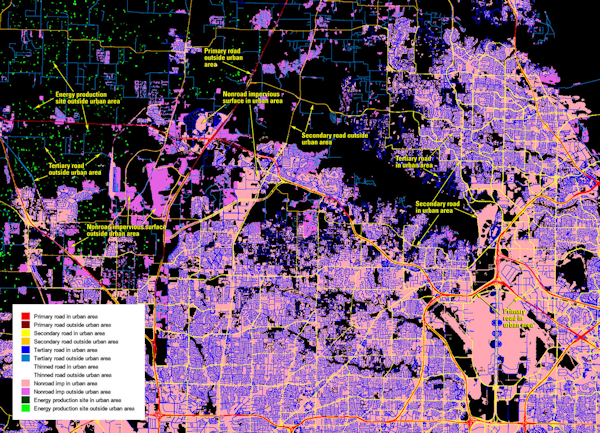 |
| Datasets in the National Land Cover Database map various U.S. land cover, such as crops or forests. The data map above shows roadways and oil production facilities in an 80-odd square mile area northwest of Dallas, TX. Image: USGS via Public Domain. |
Reporter’s Toolbox: Whether Wetlands or Blacktop, Land Cover Database Provides Foundation for Environmental Reporting
By Joseph A. Davis
With the U.S. Geological Survey, journalists can always feel, er, grounded.
So the USGS National Land Cover Database helps reporters check stories about everything from trees to blacktop. The NLCD offers solid work from good scientists and calibrated machines. Now improved. And soon to be upgraded.
Covering wetlands? The database has you covered. Urban development? Of course. Agricultural land use? The data is here even before the upcoming Farm Bill.
Nowadays the audiences for environmental journalism love those big scrolly interactives on the web. Well, this trove of data is perfect for making them sing.
Where the data come from
Satellites! That’s where the data come from.
Foremost is Landsat. One of the nicest things about Landsat (besides being open and free) is that coverage by this succession of satellites started back in 1972. Eight successive Landsats have flown, with the ninth coming soon.
Landsat can offer very long time series
— which for us journalists means we can
talk intelligently about environmental change.
This means it can offer very long time series — which for us journalists means we can talk intelligently about environmental change. Which is a big thing on the ground as well as in the atmosphere. [Editor's Note: See an earlier Toolbox on resource-related stories using Landsat.]
USGS and its partners ground-truth and calibrate the satellite data using other observations. It’s pretty fine resolution. Landsat uses 30-meter resolution, i.e. 30 meters per pixel. Even if you can’t read license plates at that level, you could almost pick out individual lots in a neighborhood.
And even though the satellites are not launched every year, the data itself is updated every five years. It is presented in graphic format.
One reason this database is so good is that it draws on the expertise of many agencies (besides NASA and USGS). They collaborate via what’s called the Multi-Resolution Land Characteristics Consortium, or MLRC.
The MLRC includes the Bureau of Land Management, the National Forest Service, the Agriculture Department, the Fish and Wildlife Service, the National Park Service, the Environmental Protection Agency and more. Canada and Mexico are also involved.
The data is free, online, downloadable and well-documented.
How to use the data smartly
One quick way to start exploring NLCD data is to look at it via maps. A handy one is from the Commission for Environmental Cooperation (which includes the United States, Canada and Mexico). Another is called the MRLC NLCD Viewer. There are more.
The native data is in raster format — it’s just pixels, like a bitmap. But because the images are multispectral (which is what allows scientists to know about the land cover) it is more complicated. Think of a color bitmap.
As a consequence, journalists who want to use the data to illuminate human impacts will probably want to overlay NLCD data with map-formatted data of their own choosing. This will require skills in handling map data. If you are not a geek, you will want to recruit one for your team.
Still, there are some inquiries that the NLCD data is designed to answer immediately — such as the condition of rangeland, forests or urban pavement.
Joseph A. Davis is a freelance writer/editor in Washington, D.C. who has been writing about the environment since 1976. He writes SEJournal Online's TipSheet, Reporter's Toolbox and Issue Backgrounder, and curates SEJ's weekday news headlines service EJToday and @EJTodayNews. Davis also directs SEJ's Freedom of Information Project and writes the WatchDog opinion column.
* From the weekly news magazine SEJournal Online, Vol. 8, No. 23. Content from each new issue of SEJournal Online is available to the public via the SEJournal Online main page. Subscribe to the e-newsletter here. And see past issues of the SEJournal archived here.
SEJ Publication Types:
Topics on the Beat:
Region:
Visibility:

