


SEJournal Online is the digital news magazine of the Society of Environmental Journalists. Learn more about SEJournal Online, including submission, subscription and advertising information.
December 13, 2023
 |
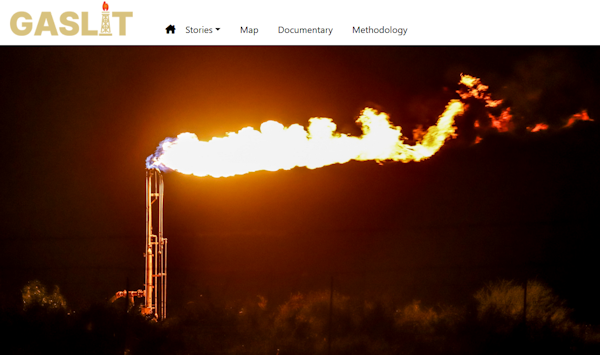 |
| Screenshot from “Gaslit,” an SEJ first-place student reporting winner and Pulliam Award honorable mention. |
Reporter’s Toolbox: Student Journalists Show the Way on Data With Methane Flaring Project
By Joseph A. Davis
Flaring — the deliberate burning of fossil methane gas from drilling sites — is one of the causes of global warming that’s easiest to fix. But we haven’t really fixed it yet.
So we were impressed when a team of students from Arizona State University’s Cronkite School of Journalism focused on the problem using flaring data in a project that won a Pulliam Award from the Society of Environmental Journalists.
They showed that data projects lead to good journalism. And that data itself is just the beginning of the stories.
A little background
Methane is the main ingredient in “natural gas,” and it hurts the environment in two ways.
First, it is a powerful greenhouse gas in and of itself, capturing solar heat and warming the Earth.
Second, when it is wasted or disposed of by burning (flaring), it releases carbon dioxide, another greenhouse gas, also warming the Earth. Flaring also releases other air pollutants.
Drillers often don't have pipes to
move gas to where it can be sold
and used. So they flare it instead.
Why flaring? Oil and gas often occur together underground. Wells whose main purpose is to recover oil often view gas as an unwanted byproduct. Drillers (and other facilities downstream) often don't have collection and transmission pipes to move it to where it can be sold and used. So they flare it instead.
Not coincidentally, the Biden Environmental Protection Agency just announced a final methane rule Dec. 2 at the COP28 climate meeting. It mostly applies to leaked methane. The oil industry opposes it and environmentalists support it.
Where the data comes from
The Arizona students, whose multistory project is titled “Gaslit,” used data from a multispectral imaging satellite — the Visible Infrared Imaging Radiometer Suite, or VIIRS, on the Suomi National Polar-orbiting Partnership satellite — flown by a multi-agency partnership spearheaded by NASA.
The data was distributed by the Earth Observation Group at the Colorado School of Mines. You can access and download it here.
The satellite’s sensors measure several bands in the infrared part of the spectrum — at night, all over the world. An algorithm called Nightfire distinguishes methane flaring from other heat sources like wildfires. The measurements have been taken pretty much daily over the period between December 2017 and December 2023. Other data come from previous satellites.
The downloadable data comes in several formats. One is the CSV format, essentially flat data. Another is the KML format, which is formatted by the keyhole markup language, in compressed (ZIP) form. KML is inherently mappable — and actually browseable by Google Earth.
The whole data collection is well documented (start here). As to the quality and reliability of the data, we think it is pretty good.
How to use the data smartly
Just one good example of smart use of this data comes from the Gaslit student project itself.
The students found that the flaring observed by the satellite was often much more than the amount reported by the state for the same sources. They explored the economics that underlies flaring. They looked at the special issues around flaring on Native American lands.
Since the data is worldwide, another possibility is to look analytically at flaring practices in various countries and how they relate to their regulatory approaches.
One story opportunity would
be to look at the connections
between flaring and air pollution.
Another opportunity would be to look at the connections between flaring and air pollution, or even respiratory disease, as much data is available on those subjects.
Be advised, though, that the most story opportunities will be found where the greatest flaring is going on. That means oil- and gas-producing states, especially Texas, Louisiana, Wyoming, Colorado and Pennsylvania.
And, as always, remember that the data is just the start of the story — and groundtruth whatever you can.
Joseph A. Davis is a freelance writer/editor in Washington, D.C. who has been writing about the environment since 1976. He writes SEJournal Online's TipSheet, Reporter's Toolbox and Issue Backgrounder, and curates SEJ's weekday news headlines service EJToday and @EJTodayNews. Davis also directs SEJ's Freedom of Information Project and writes the WatchDog opinion column.
* From the weekly news magazine SEJournal Online, Vol. 8, No. 45. Content from each new issue of SEJournal Online is available to the public via the SEJournal Online main page. Subscribe to the e-newsletter here. And see past issues of the SEJournal archived here.
SEJ Publication Types:
Topics on the Beat:
Region:
Visibility:

