







SEJournal Online is the digital news magazine of the Society of Environmental Journalists. Learn more about SEJournal Online, including submission, subscription and advertising information.
July 22, 2026
 |
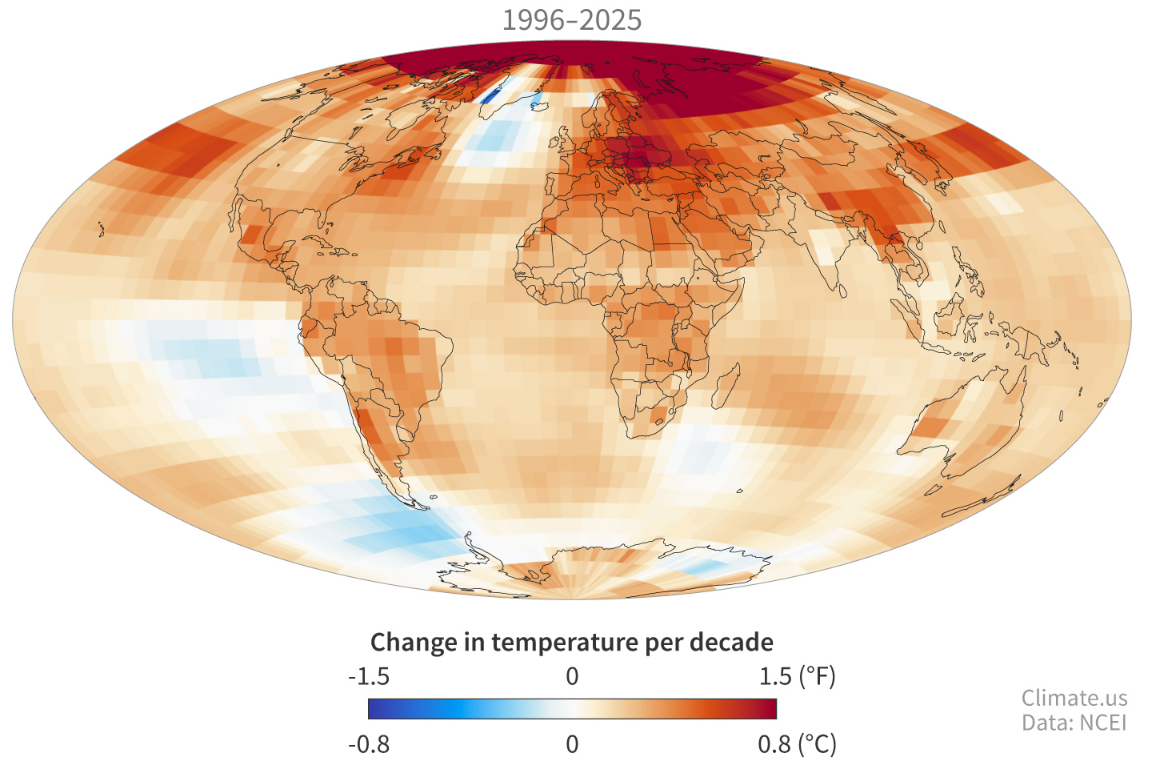 |
| A map using NOAA data captured by the nonprofit successor to the federal government's defunct Climate.gov site, showing that the rate of global warming has been faster in the past three decades than it was over the previous century. Image: Climate.us |
Reporter’s Toolbox: Climate Data Site Spiked, Resurrected by Ex-NOAA Employees
By Joseph A. Davis
 |
Dylan aside, you actually do need a weatherman to know which way the wind blows.
So a group of former employees at the National Oceanic and Atmospheric Administration, fired by Trump, has reconstructed the climate.gov website that his administration dismantled.
This data, apparently, was so important that the Trump administration, or its version of NOAA, did not want you, the public, to be able to find it or understand it.
But here’s where you can access climate.us, the reconstruction.
Many environmental reporters panicked when Trump was elected for a second term, fearing he would make all climate data disappear. Maybe he would if he could.
The first law of data conservation
(“data can neither be created
nor destroyed; it only
changes servers”).
But technically this would be impossible, because of the Toolbox’s first law of data conservation (“data can neither be created nor destroyed; it only changes servers”).
If it is important, somebody has already kept a copy.
Trends made easy to see
Let’s be honest: The fundamental data about climate — the bits, bytes and pixels — are of use or interest mostly to scientists. The former NOAA website had plenty of data; it threatened Trump because it showcased what the data means.
Climate.us does this part well. Look, for example, at the new site’s global climate dashboard. It’s all data. But the data are presented in line-graph form, so you can quickly and easily see what the important trends are. (Spoiler: They’re not good.)
On a single-page view, you can see declining Arctic sea ice, rising atmospheric CO2, ENSO cycles, glacial melting, ocean heat, sea level, solar activity, sea surface temperature and more.
Each click on one of these takes you through to a deeper level of detailed data. More clicks to go deeper. Mostly presented in graphic form. And with footnotes to published academic sources, which Trump cannot defund.
No ‘assessment’ goes unpublished
We like the fact that it’s not just pure data. For example, it includes full published versions of the five editions of the National Climate Assessment (here’s the latest one).
Therein lies a tale.
The “National Assessment,” as fans call it, is the one publication that the fossil lobby has tried the hardest to unpublish. The assessment is actually required by law (the Global Change Research Act of 1990) to be compiled and published. It is meant to be an expert multidisciplinary look at how climate change will affect each region of the U.S.
The first one was not finished and published until very late in the Clinton administration. Then the incoming Bush-Cheney administration, sympathetic to fossil industries, tried to suppress it (SEJournal has chronicled this).
How could it be possible to unpublish any documents that have already been published? Turns out it really wasn’t. Somebody kept a copy. We note as an aside that most federal documents are not subject to copyright.
Useful for journalists, educators
The climate.us site has all sorts of other information goodies that are useful and interesting to journalists (not just what we geeks call “data”). It has a whole submenu just labeled “News & Features.” For any of us looking for story ideas.
The site has another substantial menu of stuff meant to be used by teachers — another group trying to explain abstruse data to a nonspecialist audience.
The new site even links back to
some web pages still online from
the actual federal government.
How’s that for open data?
The new, nongovernmental site even links back to some webpages still online from the actual federal government. How’s that for open data?
Most of the funding for the site’s first year of operation came from an anonymous donor. Also, some $250,000 (one-third of the initial support) came from more than 2,500 small donations. Additional support comes from the nonprofit Multiplier.
Toolbox thanks Rebecca Lindsey, Anna Eshelman, Mary Lindsey, Michon Scott, Robert Simmon, Haley Crim and the other skilled workers who produced, and are still producing, this useful site.
[Editor’s Note: For more on climate change data, see our collection of climate-related Toolboxes on our Topic on the Beat page, along with numerous other climate stories and special reports, and EJToday’s climate headlines.]
Joseph A. Davis is a freelance writer/editor in Washington, D.C. who has been writing about the environment since 1976. He writes SEJournal Online's TipSheet, Reporter's Toolbox and Issue Backgrounder, and curates SEJ's weekday news headlines service EJToday and @EJTodayNews. Davis also directs SEJ's Freedom of Information Project and writes the WatchDog opinion column.
* From the weekly news magazine SEJournal Online, Vol. 11, No. 27. Content from each new issue of SEJournal Online is available to the public via the SEJournal Online main page. Subscribe to the e-newsletter here. And see past issues of the SEJournal archived here.
SEJ Publication Types:
Topics on the Beat:
Region:
Visibility: