


SEJournal Online is the digital news magazine of the Society of Environmental Journalists. Learn more about SEJournal Online, including submission, subscription and advertising information.
July 10, 2019

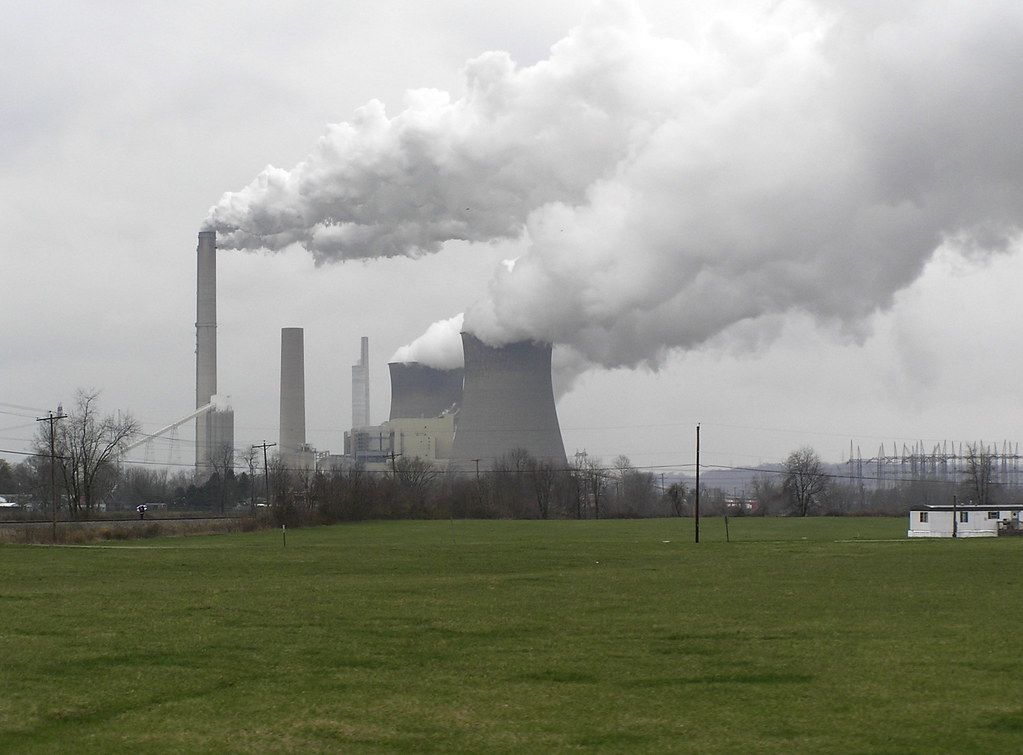 |
| A coal-fired power plant in Cheshire, Ohio, one of the largest in the nation. Greenhouse gas emissions from such facilities are inventoried by the U.S. Environmental Protection Agency, and that data can be used by journalists to report on local global warming stories. Photo: peggydavis66, Flickr Creative Commons. Click to enlarge. |
Reporter's Toolbox: Greenhouse Gas Inventory Key Source for Local Climate Change Stories
By Joseph A. Davis
Wondering how to bring the global warming story home? You might find local story leads with the greenhouse gas inventory maintained by the U.S. Environmental Protection Agency.
The EPA has been collecting and keeping an inventory of U.S. greenhouse gas emissions for some 20 years. But today’s version has more detailed data, is searchable online and is more user-friendly. Bottom line: It’s gotten easier.
 |
| A screengrab of an interactive map showing greenhouse gas emissions from large facilities in the state of Kentucky, drawn from an EPA facility-level information database tool known as FLIGHT. Click here to enlarge, or visit the data mapper. |
You may find stories beginning with your local electric power plant, refinery or landfill. For instance, use the database to figure out who are the biggest greenhouse emitters near you. Then go on to report what they are doing about the emissions, how they impact people and what the government could do.
You don’t need to be a data geek. Without getting into all the complex issues of greenhouse gas accounting, you can still inform your audience about what’s important.
It matters because the United States is still one of the largest greenhouse gas emitters in the world (after China), and because climate change will make many parts of the globe unlivable and cost nations trillions. That’s another story.
Knowing the backstory helps. Nations, including the United States, did not always keep good inventories of their greenhouse gas emissions — and they still fall well short of that goal.
But there has been progress. The U.S. Congress made some form of inventory of greenhouse gas, or GHG, mandatory in a 2007 appropriations bill. The measure was then implemented in EPA’s Final Rule for Mandatory Reporting of Greenhouse Gases in 2009.
Also, the Paris Climate Agreement of 2015 essentially required good GHG inventories from virtually all signatories — which is to say, virtually all nations in the world. That requirement really originated in the underlying U.N. Framework Convention on Climate Change of 1992 (more on that here).
Where the data comes from
The U.S. system has evolved from a sophisticated set of estimates to a dataset based on mandatory reporting by individual industrial facilities above a certain size. Moreover, it has grown beyond counting just CO2 emissions to include an array of other greenhouse gases, including methane, nitrous oxide and certain fluorinated compounds.
The inventory is reported to Congress in summary form every year and the data in their final form go well beyond the greenhouse gas reporting program.
The GHG Reporting Program requires reporting by
some 13,000 facilities, which collectively account for
an estimated 85-90 percent of total U.S. GHG emissions.
Today, the GHG Reporting Program applies to industrial facilities (not just power plants, but facilities in 41 industrial categories) emitting more than 25,000 metric tons CO2 equivalent per year. This requires reporting by some 13,000 facilities, which collectively account for an estimated 85-90 percent of total U.S. GHG emissions.
Sophisticated accounting allows the GHG Inventory to include things like transportation, buildings, agriculture and landfills. It also includes estimates of GHG sinks.
While the inventory tries to estimate methane, an important greenhouse gas, journalists should remember that there has been resistance, bigly, from the petroleum industry to quantifying actual releases, because of industry resistance to methane emission controls.
How to use the data smartly
One thing right off: The tool EPA calls the Greenhouse Gas Inventory Data Explorer is not necessarily the right tool for finding local stories. It produces charts. It is fine for what it is, but is mainly of use for overview policy analysis of national emissions by sector, region, etc.
Handier for finding local stories is a tool acronymed FLIGHT (Facility Level Information on Greenhouse Gases Tool). It allows you to get down to the county level and to find inventoried facilities by gas, by industrial type, fuel type, etc., as well as to see the information in map form (here’s an example).
One key caveat is that EPA publishes the data before its efforts to check submitted data are complete. You should not try selling GHG Inventory data to your audience as infallible Gospel. They are more like a first rough draft.
True geeks will be happy to learn that you can, in fact, download the whole data set (in spreadsheet form) to perform whatever tricks of your own you fancy. But true geeks will also remember how variegated the data are, by source and category — and not try to push it farther than it will go.
If you want to get into the weeds, it may be worth knowing that you can get another view into this type of data using EPA’s Envirofacts data tool. It may include other relevant or desirable information, such as the verification status of a particular piece of data.
One of the best ways to get oriented on this complex dataset will be to download the current annual report and read it.
Joseph A. Davis is a freelance writer/editor in Washington, D.C. who has been writing about the environment since 1976. He writes SEJournal Online's TipSheet and Reporter's Toolbox columns. Davis also directs SEJ's WatchDog Project and writes WatchDog Tipsheet, and compiles SEJ's daily news headlines, EJToday.
* From the weekly news magazine SEJournal Online, Vol. 4, No. 27. Content from each new issue of SEJournal Online is available to the public via the SEJournal Online main page. Subscribe to the e-newsletter here. And see past issues of the SEJournal archived here.
SEJ Publication Types:
Topics on the Beat:
Region:
Visibility:

