


SEJournal Online is the digital news magazine of the Society of Environmental Journalists. Learn more about SEJournal Online, including submission, subscription and advertising information.
March 23, 2022

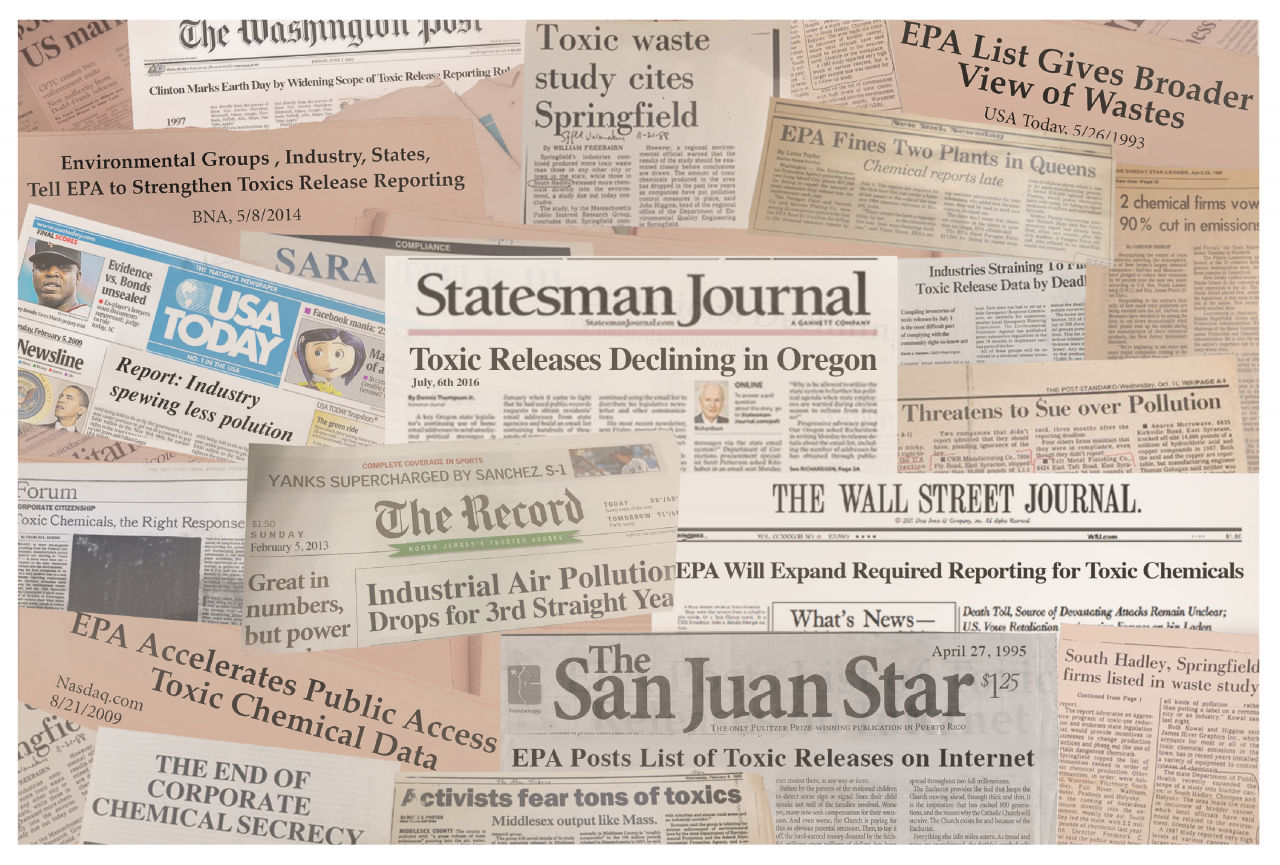 |
| News coverage from the annual update of the Toxics Release Inventory can be creative, localizable and high impact, writes the author. Photo: U.S. Environmental Protection Agency. Click to enlarge. |
Reporter’s Toolbox: Why the Latest TRI Update Should Be in Your Sights for Stories
By Joseph A. Davis
The latest edition of the Toxics Release Inventory is just out. And before you switch off your reporting radar for this decades-old online, searchable and downloadable database from the U.S. Environmental Protection Agency, be aware there are some important changes — and some smart ways to make better use of it in your journalism.
The TRI database is a foundational resource for anyone investigating industrial toxic chemicals in the United States. Congress mandated it in a 1986 law. The first national database came out in 1989 — and the duration of this annual time series adds to its power as an investigative tool.
In its first years, the list included more than 320 chemicals; today, it includes 775 chemicals and 33 chemical categories. You can start exploring here.
It’s easy to find news pegs in TRI data this year.
The big headline in this year’s data is that
toxic releases declined 10 percent overall nationally.
It’s easy to find news pegs in TRI data this year. The big headline in this year’s data is that toxic releases declined 10 percent overall nationally — a general trend that has been going on for decades.
Also, as expected, Congress recently mandated that EPA add certain PFAS (“forever chemicals”) to the list that must be reported under TRI. Congress did this in the Defense Authorization, which only became law in December 2021.
Some PFAS chemicals were in the 2020 database, and there may be more next year. It will spawn many stories. Or should.
Also in December 2021, EPA changed the TRI reporting threshold for ethylene oxide (which has been in the news a lot lately), so that more facilities will have to report it. That will take effect next year.
Where the data comes from
Industrial facilities are required to report to EPA annually if they handle listed chemicals in amounts above certain thresholds. Handling may just mean having or storing a chemical at the site.
But facilities are also required to report quantities processed into other chemical forms, transferred to another site, released to air or water or disposed of. Facilities self-report online, but EPA checks their work to some extent.
There is a time lag in TRI data. Facilities report quantities handled the immediate past year, and then EPA takes some time to process the data. The data are released in nonfinal form even before EPA is finished with it. EPA comes up with state and national analyses, which are very handy for journalists. The latest final release covers the calendar year 2020.
Using the data smartly
Pardon Toolbox for saying so — but for many years some journalists covering the TRI release did so unimaginatively.
The easy road was to take the state summary (and many journalists were writing for state audiences) and highlight the fact that the home state had dropped from, for example, second-highest for a given pollutant to fifth-highest. End of story. And the stories were often done by general assignment reporters.
It doesn’t have to be that way.
One shining example is the recent ProPublica Sacrifice Zones package. Yes, it’s brilliant public service and data journalism. But way down at the bottom (where builders put the concrete footings) it is based on the TRI.
And in the case-study sidebar stories, the ProPublica team demonstrated one of the best uses of TRI data — namely, finding the environmental justice stories that grow out of the exposure of fenceline and frontline communities to dangerous chemicals.
Localizing, translating the data
Over the years, TRI has evolved increasingly into map-format presentation. The latest release takes this further, making those environmental justice stories easier to find.
But even though your story may end up being hyperlocal, it is worth taking some time to explore this year’s TRI National Analysis and state and regional summaries.
One virtue of the TRI is that it tells you where the toxic chemicals are. That means cancer-causing chemicals, neurotoxins, persistent and bioaccumulative chemicals, and other hazardous chemicals (e.g., chlorine).
Part of your job as a reporter is to translate this knowledge into an understanding of how it affects people and ecosystems. That may mean people working at the plant — or at the fenceline, or downwind or downstream.
It’s important to understand that the health threats from a given chemical depend on many factors: the amount released, the toxicity of the chemical, the actual exposure of specific people to the chemical, etc. Given the data, your story is only started.
Some people may be surprised to discover that not all releases of chemicals on the TRI list are regulated under the nation’s main environmental laws. This is another reason why we need journalists and other community watchdogs. Ask. Look at the permits.
To TRI fans, a big piece of welcome news is the
overall improvement in presentation of data this year. ...
Better documentation, training and support may
make the data accessible to a wider audience.
To TRI fans, a big piece of welcome news is the overall improvement in presentation of data this year. Some of the improvement is just progress, and some should be credited to Biden and EPA Administrator Michael Regan.
There are not only several different ways to view the data, but also good explanations of which ways may work best for you. Better documentation, training and support may make the data accessible to a wider audience.
This year, EPA made further strides toward encouraging users to view the data in map format. This is important because toxic releases are very place-specific. That’s what ProPublica did so well.
EPA’s national analysis makes clear that this is just one of many changes meant to better address environmental justice concerns.
[Editor’s Note: SEJournal has published many Toolboxes and TipSheets on using TRI over the years. See, for instance, “Early Toxics Release Inventory Data Can Yield Scoops,” “Mapping Toxic U.S. Hotspots Down to the Neighborhood Level,” “Toxics Database a Key Tool for Environmental Journalists,” “TRI National Analysis Dangles Leads for Investigative Stories” and “Use EPA TRI Database To Find Toxic Threats.” Also follow EJToday headlines on chemicals and toxics.]
Joseph A. Davis is a freelance writer/editor in Washington, D.C. who has been writing about the environment since 1976. He writes SEJournal Online's TipSheet, Reporter's Toolbox and Issue Backgrounder, and curates SEJ's weekday news headlines service EJToday and @EJTodayNews. Davis also directs SEJ's Freedom of Information Project and writes the WatchDog opinion column.
* From the weekly news magazine SEJournal Online, Vol. 7, No. 12. Content from each new issue of SEJournal Online is available to the public via the SEJournal Online main page. Subscribe to the e-newsletter here. And see past issues of the SEJournal archived here.
SEJ Publication Types:
Topics on the Beat:
Region:
Visibility:

