


SEJournal Online is the digital news magazine of the Society of Environmental Journalists. Learn more about SEJournal Online, including submission, subscription and advertising information.
March 25, 2026
 |
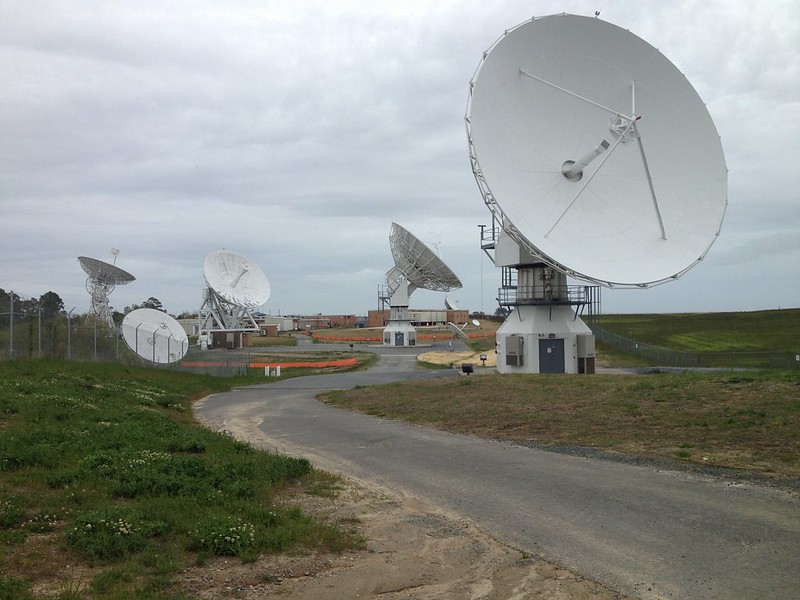 |
| Satellite dishes at the NASA facility at Wallops Island on the eastern shore of Virginia. Photo: NOAA Satellites/GOES-R program via Flickr Creative Commons (Public Domain). |
Reporter’s Toolbox: NASA Earthdata Offers a New Look at What Satellites See Down Here
By Joseph A. Davis
A big share of data about our earthly environment comes from satellites. A lot of the time, it comes from National Oceanic and Atmospheric Administration satellites flown on NASA rockets. But not always.
NASA actually flies its own Earth-exploring satellites, which collect massive amounts of data in their own right.
Not only is Trump forbearing to
destroy this treasure but, in fact,
NASA is upgrading its data site.
Avid readers of Toolbox may recall that we wrote about some NASA data last July. But we have an update: Not only is Trump forbearing to destroy this treasure but, in fact, NASA is upgrading its data site.
All those megapetabytes are being newly presented on a nifty refurbished site called Earthdata. NASA says the upgrade — which they call the web unification project — will take the rest of 2026.
It looks better already, because it’s organized by what you are looking for. It’s no longer rocket science.
Where the data comes from and how to use it smartly
If you drive to the beach at Chincoteague, Virginia, you will go by an army of dish antennas pointed expectantly skyward at Wallops Island. That’s NASA gathering data.
Stop at the museum and learn. Stop in town and eat oysters. Stop at the spaceport and watch rockets launch (best at night).
Come for the egrets, stay for the data.
Here are a few of its treasures for environmental reporters:
- Groundwater: Groundwater is being depleted in a lot of places, especially because of irrigation, overuse and drought. NASA offers several datasets that measure groundwater depletion. It also measures land subsidence from depletion.
- Cryosphere: Ice is changing both seasonally and because of climate change. NASA data tells about snow cover, sea ice extent, ice thickness, permafrost, snow and ice albedo (reflectivity), glacier loss, ice sheets and more.
- Land Surface: Remember, NASA is covering the entire Earth, 30% of which is land. Satellites are telling us about shrinking forests, warming land, soil erosion, vegetation types, land use, topography, soil moisture, wildfire, floods, landslides and a lot more.
- Atmosphere: Satellites tell us much about Earth’s 60-mile-thick atmosphere, including pollutants like particulates, nitrogen dioxide, carbon monoxide, dust and smoke. They also measure many variables related to climate, such as reflectance, trace gases, solar radiation and albedo. We earthlings may care most about weather-related data, whether on lightning, hurricanes, humidity, winds, precipitation or fog.
- Biosphere: Satellites measure vegetation types, vegetation extent, vegetation condition, canopy height, deforestation, habitat types and condition, biomass types, conservation of protected areas, algal blooms, nighttime lights and more.
- Ocean: Most of what NASA satellites see is water. They send back data on sea surface temperature, salinity, ocean color, sea surface height (for ENSOs), nutrients, chlorophyll, ocean currents, sea level rise, biogeochemical cycles, waves and winds, nutrients and tsunamis.
- Human Dimensions: Satellites see what humans do to the planet as well. That includes things like agricultural land use and crop types, not to mention human settlement and urbanization. They also offer data on land and water management, and many variables related to climate adaptation.
[Editor’s Note: Explore more on using NASA satellite data for your reporting, as well as tapping satellite data to cover sea surface temperature, crop cover, wildfire smoke, land surface and land cover, bird migration and ship tracking. Plus, lost datasets and disappearing climate data, how one reporter used satellite data to ID tensions between food production and biodiversity and a group of student journalists used satellite data to pinpoint methane flaring.]
Joseph A. Davis is a freelance writer/editor in Washington, D.C. who has been writing about the environment since 1976. He writes SEJournal Online's TipSheet, Reporter's Toolbox and Issue Backgrounder, and curates SEJ's weekday news headlines service EJToday and @EJTodayNews. Davis also directs SEJ's Freedom of Information Project and writes the WatchDog opinion column.
* From the weekly news magazine SEJournal Online, Vol. 11, No. 12. Content from each new issue of SEJournal Online is available to the public via the SEJournal Online main page. Subscribe to the e-newsletter here. And see past issues of the SEJournal archived here.
SEJ Publication Types:
Topics on the Beat:
Region:
Visibility:

