


SEJournal Online is the digital news magazine of the Society of Environmental Journalists. Learn more about SEJournal Online, including submission, subscription and advertising information.
January 31, 2024
 |
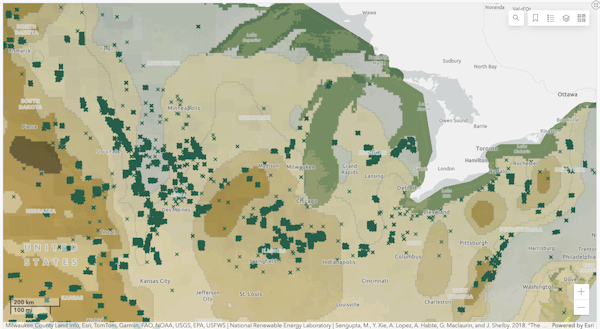 |
| A map infographic showing the location of wind turbines, solar installations and other clean energy sources in a cross-section of the United States. Image: Screenshot of EIA Renewable Electricity Infrastructure and Resources Dashboard. |
Reporter’s Toolbox: Take This Clean Electricity ‘Dashboard’ for a Trip Into the Energy Transition Future
By Joseph A. Davis
First of two parts on energy data from the U.S. Energy Information Administration. Read part two.
How’s that trip toward the energy transition going for you? Maybe you need a dashboard — the Renewable Electricity Infrastructure and Resources Dashboard?
When it comes to energy data, the U.S. Energy Information Administration is usually one of the most reliable sources, especially for U.S. data. It’s free, pretty up to date and as nonpartisan as any government agency you will find.
And while this particular dashboard won’t let you actually drive the energy transition, it will give you a clearer view of how slow or fast we are going (or whether we are heading off a cliff).
What it offers is not terabytes of raw data for you to have to crunch in your spreadsheets (sorry, data geeks). What it does offer is the summary overview in its own array of tables and spreadsheets. The terabytes are what it is built from. And from it, you get perspective.
Where the data comes from
EIA is administratively located under the Energy Department, although it is independent. Its origins go back to the “energy crisis” of the 1970s, but when Congress set up the department in 1977, it mandated that EIA be independent. It also mandated that it be staffed by experts and that its information be audited.
EIA gets a lot of its information from states and other federal agencies. By law, EIA has the authority to require data submissions from private companies (e.g., oil companies and electric utilities) and the authority to enforce this requirement.
So EIA can send questionnaires to utilities and require that they answer them. But other federal agencies have data as well — for example, the Federal Energy Regulatory Commission, which licenses all hydroelectric power in the U.S. EIA integrates the FERC data into its products.
If you report on energy-environment
issues, you will want to discover
the much larger universe of
data products that EIA offers.
If you report on energy-environment issues, you will want to discover the much larger universe of data products that EIA offers. We hope to highlight more of them in future Toolboxes. Or you can explore them yourself starting from here.
For now, suffice it to say that EIA offers data on every form of energy and the state, national and international levels. It offers various analyses that are especially relevant to environmental reporters — such as pollution control on fossil power plants.
And, in recent years, it has increasingly presented data in map formats, which allow you to explore the connections of energy with other mappable dimensions, like demographics.
How to use the data smartly
The dashboard tool is ideal for looking at state-by-state variations in clean energy performance, which can have a lot to do with both politics and natural resources. The on-the-ground (and on-the-grid) realities of state green energy production may be more worth tracking than state “goals” for the year 2050.
On another level it is useful to have a list of every hydro facility in the United States, every pumped storage facility, every wind farm and utility-scale solar installation — not to mention geothermal. If you wanted to, you could pull that data into your spreadsheet.
One shortcoming of the dashboard is that it doesn’t give year-by-year time series, which you would need to assess how fast various renewables have grown (or are growing) in the nation or in your states of interest. EIA offers such data elsewhere.
Finally, there is the problem of “biomass.” What is it, and is it really green? The answer for wood pellets may be quite different from that for landfill gas. It’s a handy category … until it’s not handy or meaningful in climate terms. This is hardly EIA’s fault. But we warned you.
[Editor’s Note: Part two of this two-part series covers energy transition insights from EIA's trove of power plant data. Also check out more energy-related Toolboxes on using data to track methane flaring, and on a fossil fuels registry, a drilling database and a wind turbine spreadsheet. Plus, be sure to visit our Topic on the Beat: Energy page and get the latest EJToday headlines on energy.]
Joseph A. Davis is a freelance writer/editor in Washington, D.C. who has been writing about the environment since 1976. He writes SEJournal Online's TipSheet, Reporter's Toolbox and Issue Backgrounder, and curates SEJ's weekday news headlines service EJToday and @EJTodayNews. Davis also directs SEJ's Freedom of Information Project and writes the WatchDog opinion column.
* From the weekly news magazine SEJournal Online, Vol. 9, No. 5. Content from each new issue of SEJournal Online is available to the public via the SEJournal Online main page. Subscribe to the e-newsletter here. And see past issues of the SEJournal archived here.
SEJ Publication Types:
Topics on the Beat:
Region:
Visibility:

